Conversational AI
Chatbot Human Handover: When the Bot Should Step Aside
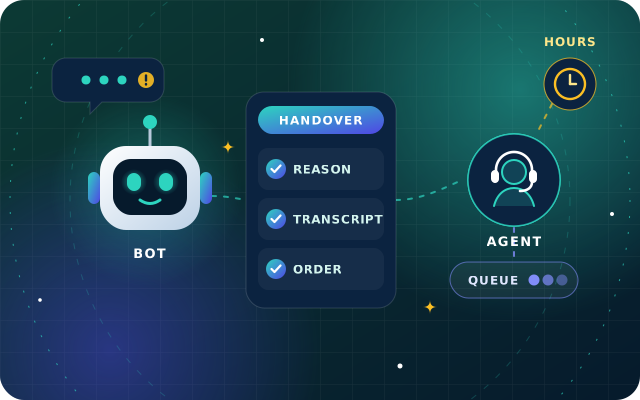
Triggers, handover packets, queues, business hours and customer messages for passing chats to people, plus the measures that show whether it works.
· 9 min read
A dashboard full of numbers is not the same as knowing whether your chatbot helps. Here are the chatbot metrics that matter, how to define and measure each one, the vanity metrics to drop and a monthly review routine your team can keep.
Key takeaways
Most chatbot dashboards open with a big number: conversations this month, messages handled, hours saved. It looks impressive and tells you very little about whether customers got what they came for.
The chatbot metrics that matter measure outcomes. Was the customer's problem solved? How did they feel about it? Did the bot hand over when it should have, and did a person reply in good time? Did the conversations that should end in a booking, a lead or a payment actually get there? This guide defines each metric, shows how to measure it, flags the vanity metrics to drop and sets out a monthly review routine.
Metrics only make sense against a job. A bot that answers order status, one that books appointments and one that qualifies sales leads succeed in different ways, so list the jobs first, as you would when choosing a conversational AI chatbot. Then fix three definitions before you count anything:
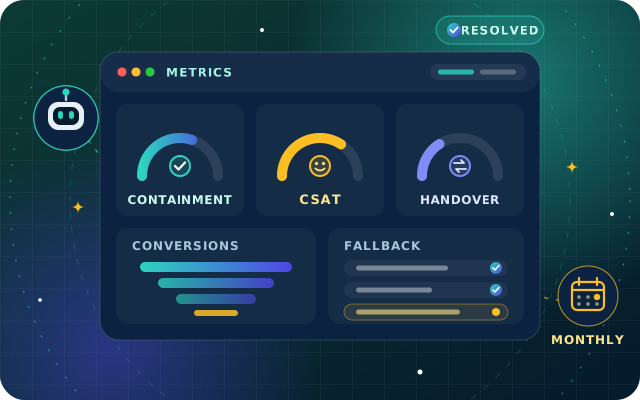
Seven measures cover most of what a service team needs to know. Write the definitions down, because two tools, or two analysts, rarely count the same way by default.
| Metric | How to calculate it | Watch out for |
|---|---|---|
| Containment rate | Conversations that ended without an agent, divided by all conversations in scope | Customers who gave up may be counted as contained |
| Resolution rate | Conversations where the need was met without an agent, divided by all conversations in scope | Needs evidence: a confirmation, a completed flow or no repeat contact |
| Customer satisfaction (CSAT) | Satisfied survey responses divided by all survey responses | Low response rates, and unhappy customers who never answer |
| Handover rate | Conversations passed to a person, divided by all conversations, split by trigger | Lower is not always better |
| First response time | Time from a customer's message to the first reply, by the bot and, after handover, by a person | Averages hide long waits; report the median and the slowest tenth |
| Fallback rate | Customer messages the bot could not understand or answer, divided by all customer messages | Rises after product, price or policy changes |
| Conversion rate | Conversations that completed a goal, divided by those that started it | Count the outcome in your business systems, not just the click |
Containment is the easiest metric to report and the easiest to flatter. A customer who gives up after two unhelpful answers ends the conversation without an agent, so they count as contained. Resolution asks the harder question: was the need actually met?
Evidence can come from a closing question such as "Did that answer your question?", from a completed flow, such as a confirmed booking, or from the absence of a repeat contact on the same topic within a window you choose, for example seven days. Whatever tool you use, check exactly how it defines containment before you compare one month with the next.
Ask one short question at the end of the conversation, a thumbs up or down or a rating from one to five, with an optional comment. Report the share of satisfied answers together with the response rate, and split it by whether a person was involved. The comments are often more useful than the score, because they say which answer annoyed the customer.
Handover is not a failure. Complaints, disputes and sensitive topics should reach a person, and a bot that never hands over may be trapping customers. Report handovers by trigger, track the time from handover to the first human reply and count the customers who leave while waiting. Our guide to chatbot human handover covers the triggers and measures in detail.
Every fallback is a question the bot could not handle. Group fallbacks and low-confidence answers by topic each month, and the largest groups become your next content and training priorities. A sudden rise usually follows a change nobody told the bot about: a new product, a price change or a holiday timetable.
For sales and bookings, count the outcome where it is recorded, not only in the chat. A lead counts when it reaches the CRM with contact details and a need, a booking when it is confirmed and a payment when the money arrives. With the bot connected to your ERP (enterprise resource planning system) or CRM, such as StarBiz or Odoo through OdooStar, you can follow chat leads through to orders and see which conversations create revenue.
If you also report cost per resolved conversation, include platform fees, agent time on handovers and channel charges. On WhatsApp, Meta charges for delivered template messages at rates that depend on the template category and the recipient's country, while replies inside an open customer service window are free, as its WhatsApp Business Platform pricing page explains.
Some numbers look good in a slide and lead teams in the wrong direction. Retire these, or at least stop leading with them:
The numbers below are made up to show the arithmetic. They are not a benchmark or a target. Suppose a retailer's bot handled 1,000 conversations in a month.
The same month can be reported as "820 contained" or as "640 resolved, with one broken step in one flow". Only the second version tells the team what to fix.
A single monthly figure hides the detail that matters. Split every core metric by:
Compare each segment with its own history. Published benchmarks mix different bots, jobs and definitions, so your own previous months are the fairest yardstick.
A short session each month, with the right people in the room, keeps a bot improving instead of drifting. A routine that works:
Transcripts contain personal data, so decide who may read them, mask what reviewers do not need and keep them only as long as your policy allows, in line with the UAE's data protection laws and any sector rules that apply to you.
Tip: Keep a one-page metric dictionary with the name, formula, data source and owner of every number on the dashboard. When a figure jumps, the first question is whether the business changed or the definition did.
StarBot, our conversational AI chatbot, includes the analytics this routine needs. Its dashboard reports conversation volume by channel, language, hour and topic, a containment rate, top intents and trending questions week on week, and customer satisfaction scores from in-chat surveys. Unanswered and low-confidence questions are queued for review, and retraining from real conversations goes through an approval workflow.
Because StarBot connects to StarBiz and to Odoo through OdooStar, leads and bookings captured in chat can be followed into your CRM and ERP. During the pilot we agree the metric definitions with you, including what counts as contained and what counts as resolved, so each month is counted the same way. After launch, our optimize stage includes regular reviews of unanswered questions, new intents and use cases, so the routine above is backed by the team that built your bot. Book a free consultation, call +971 55 973 4524 or email [email protected].

Star Bit Solutions is a software company in Ajman, UAE, founded in 2014. We implement and customize Odoo Enterprise and Odoo Community, and build StarBiz (AI-driven ERP), StarHub (life super app), StarBot (conversational AI), StarLearn (adaptive learning) and StarSense (AI and IoT platform). About us
Containment, satisfaction, trending questions and a review queue for unanswered and low-confidence questions.
Learn MoreOrders, invoices, stock and leads that StarBot can look up, so chat conversions can be followed in the system of record.
Learn MoreRunning Odoo Enterprise or Community? We connect StarBot to your sales, inventory, helpdesk and CRM records.
Learn MoreTriggers, handover packets, queues, business hours and customer messages for passing chats to people, plus the measures that show whether it works.
· 9 min read
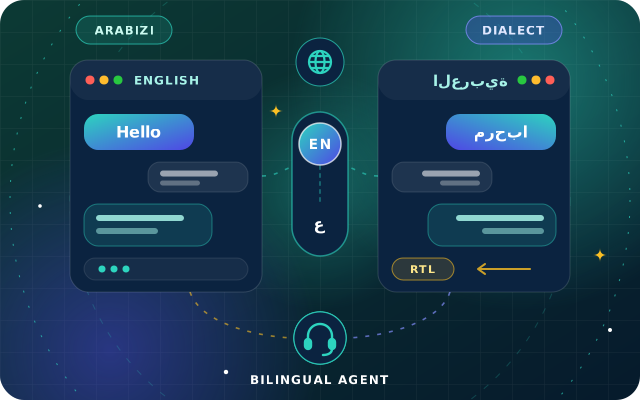
Language switching, Gulf dialect, Arabizi, right-to-left layouts, tone and bilingual handover: a practical design guide for Arabic and English chatbots.
· 10 min read
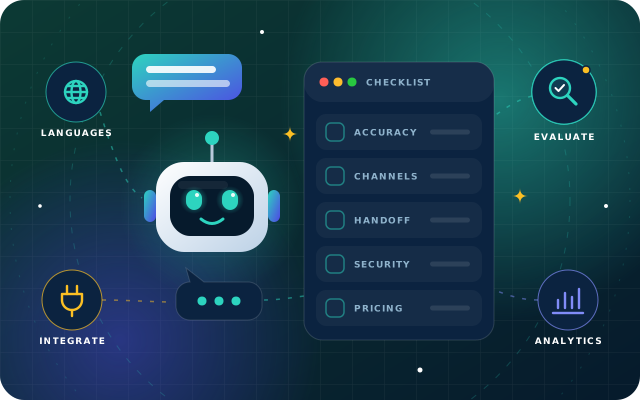
Ten criteria, the red flags to watch for and a pilot plan you can run in a few weeks.
· 8 min read
There is no universal good number, because containment depends on the jobs the bot is given, the channel and how your tool counts abandoned chats. A bot that answers order status will contain more than one that triages complaints. Set a baseline from your own first months, check it against verified resolution and judge progress by intent rather than chasing a figure from elsewhere.
Containment counts conversations that ended without a human agent. Resolution counts conversations where the customer's need was actually met, shown by a confirmation, a completed flow such as a booking, or no repeat contact on the same topic within a set window. Containment can include customers who simply gave up, so always read it alongside resolution.
Ask one short question at the end of the conversation, such as a thumbs up or down or a rating from one to five, with an optional comment. Report the share of satisfied responses alongside the response rate, and split results by channel, language, intent and whether a person was involved, because customers who abandon a chat rarely answer surveys.
It is the share of customer messages the bot could not understand or answer, so it replied with a fallback such as a clarifying question, a list of options or an offer to hand over. Track it by intent, channel and language. A rise after a product launch, price change or new policy usually means the bot's content is out of date.
Review containment and resolution together, satisfaction with its response rate, handover rate by trigger, time to the first human reply, fallback rate and conversions such as leads, bookings or payments completed. Then read a sample of transcripts in each language, agree a few changes with owners and dates, and check the following month whether they worked.
Ask for a walkthrough of the StarBot analytics dashboard. We will show you containment, satisfaction and the review queue, and build a demo around your own questions.