The Challenge
Every billing cycle at this utilities operator began with a walk. Meter readers worked through plant rooms, risers and service corridors with clipboards and handheld devices, and their readings were typed into spreadsheets before billing could start. Meters behind locked doors were estimated, transcription slips went unnoticed, and invoices trailed the consumption they charged for. It is a pattern we see across Energy and Utilities.
Between rounds the operator was blind. A leaking valve in an empty apartment or a meter that had stopped recording came to light only when a customer questioned a bill, by which time the water was lost and the dispute had to be settled from handwritten notes. Several generations of meters were installed across the network, some read by eye and others only through their own vendor software, so nobody could see the whole picture in one place. The brief was clear: automatic meter reading without replacing meters that still worked, earlier leak detection and billing that keeps pace with consumption.
- Slow billing: invoices waited for rounds to finish and spreadsheets to be checked.
- Estimated bills: inaccessible meters meant estimates, and estimates meant credit notes later.
- Late leak detection: abnormal consumption surfaced through complaints rather than data.
- Disputes without evidence: no time-stamped history to show a customer what was used and when.
Our Approach
We began with a site survey across a representative mix of buildings, recording every meter type, its interface and the connectivity in each plant room and riser. In parallel we mapped the path from meter to invoice with the billing and field teams: who reads, who checks, who bills and who handles a dispute. That map became the fit-gap list. Meters that already had a Modbus or MQTT interface could be read through StarSense gateways as they were, and new wireless LoRaWAN sensors were added only where a meter had no connection of its own, so the operator did not have to replace its meters across the network.
The rollout was phased building by building:
- Pilot: a small group of buildings went live first, with manual rounds continuing alongside so both sets of readings could be compared.
- Data cleansing: the meter register was reconciled with customer accounts and premises, so every device in the StarSense registry pointed to the right account in StarBiz.
- Parallel billing: invoices were prepared from remote readings and checked against the manual process before the switch.
- Scale-out: proven meter types rolled out across the remaining buildings with the same naming and access rules.
- Training: the billing team learned the exception queue, technicians the device health views and managers the district dashboards.
The Solution
One Registry for Every Meter
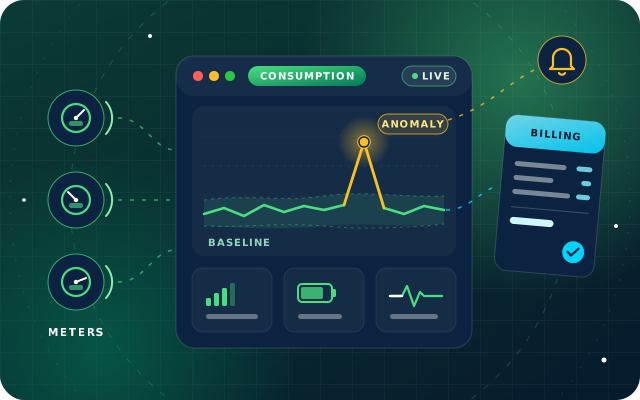
Each meter now sits in the StarSense device registry with its building, floor, unit, type and owner. Gateways speak Modbus, MQTT and LoRaWAN, so mixed generations of meters now work as one smart metering network, and local buffering holds readings when a link drops and uploads them when it returns. Device health views show heartbeat, signal strength, battery level and last-seen status, and a missing-data condition raises an alert when a meter goes quiet, instead of leaving a gap for someone to discover at billing time.
Anomaly Detection on Consumption
StarSense learns the normal profile of each meter from its own history and compares it with neighboring meters. Every reading is scored against that baseline, which catches patterns a fixed limit would miss or flag too late:
- steady flow through the night that points to a leak or a running cistern
- a sudden jump against the meter's usual pattern
- a meter whose reading stops advancing while comparable meters nearby keep recording use, a sign that it may be stuck
Alerts carry a severity level, reach the right team by email, in-app notification or WhatsApp through StarBot, and escalate to a second contact if nobody acknowledges them. Technicians confirm or dismiss each alert, and that feedback retrains the model for the network.
Validated Readings Straight to Billing
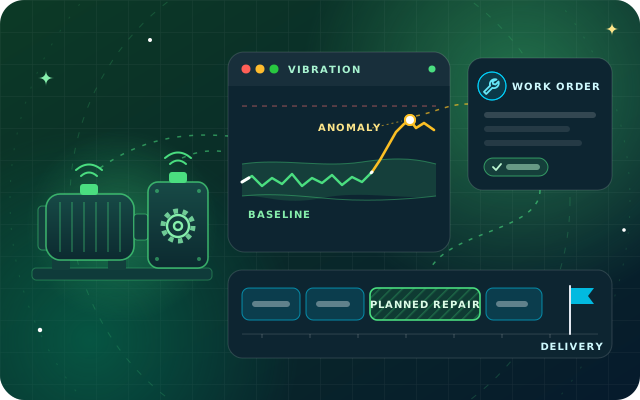
At the close of each reading cycle, readings pass from StarSense to StarBiz through the REST API, and validation rules at the boundary check each one before it is accepted. Readings that carry an open anomaly are held for review rather than billed. Routine invoices are drafted from the validated readings at the rates agreed for each account, ready for the billing team to post, while unusual cases are routed to a person. Customers see their invoices in the StarBiz customer portal. When a fault needs a visit, StarSense raises a maintenance work order in StarBiz, so the technician arrives knowing which meter and which readings triggered it.
District Dashboards for Management
Dashboards roll consumption up by building and district, with drill-down to raw readings for any period. Scheduled reports in PDF and XLSX give management a regular view of consumption trends, open alerts and meters that need attention, without anyone compiling a spreadsheet.